In this section, you can see the payment trends in terms of transaction amount (in Rupees)
- Historical Benchmarking
Here you find the transaction data benchmarked against different time durations, such as:
- Yesterday: This shows the increase/ decrease in total transaction amount on a particular day, as compared to the previous day
- Current Week vs Last Week: This shows the increase/decrease in the total transaction amount for a particular week as compared to the previous week.
- Current Month vs Any other month: You can customize the date range to compare the payments trend for your current vs any other date range.

- Payment Historic Trend
You can also view the graphical representation of these trends along with multiple filters to get a deeper insight into the payment data. Below are the filters which you could apply:-
- Duration: Select the date and time for which you want to see the total transaction amount.
- View: Depending on the time duration selected, the data is displayed in different views, i.e. Daily or Weekly
- Overlay Layers: You can also add below overlay layer on the trend graph, to get an even more granular level of insights:
- Gateways
- Payment Source
- Moving Average
- Payment Source: You can also get a high-level view of your transactions by filtering them out based on the payment source i.e. Wallet, Credit Cards, Debit Card, Netbanking, etc
- Gateways: By default, all gateways are pre-selected, however, you can get a granular-level insight into the transaction count through the Gateways filter. You can select any particular gateway or a combination of gateways to see the payment trend for a chosen period of time.
You will also find the tabular as well as the pie-chart distribution of transaction amount based on the payment source and the payment gateways for any particular time duration.

- Payment Analysis
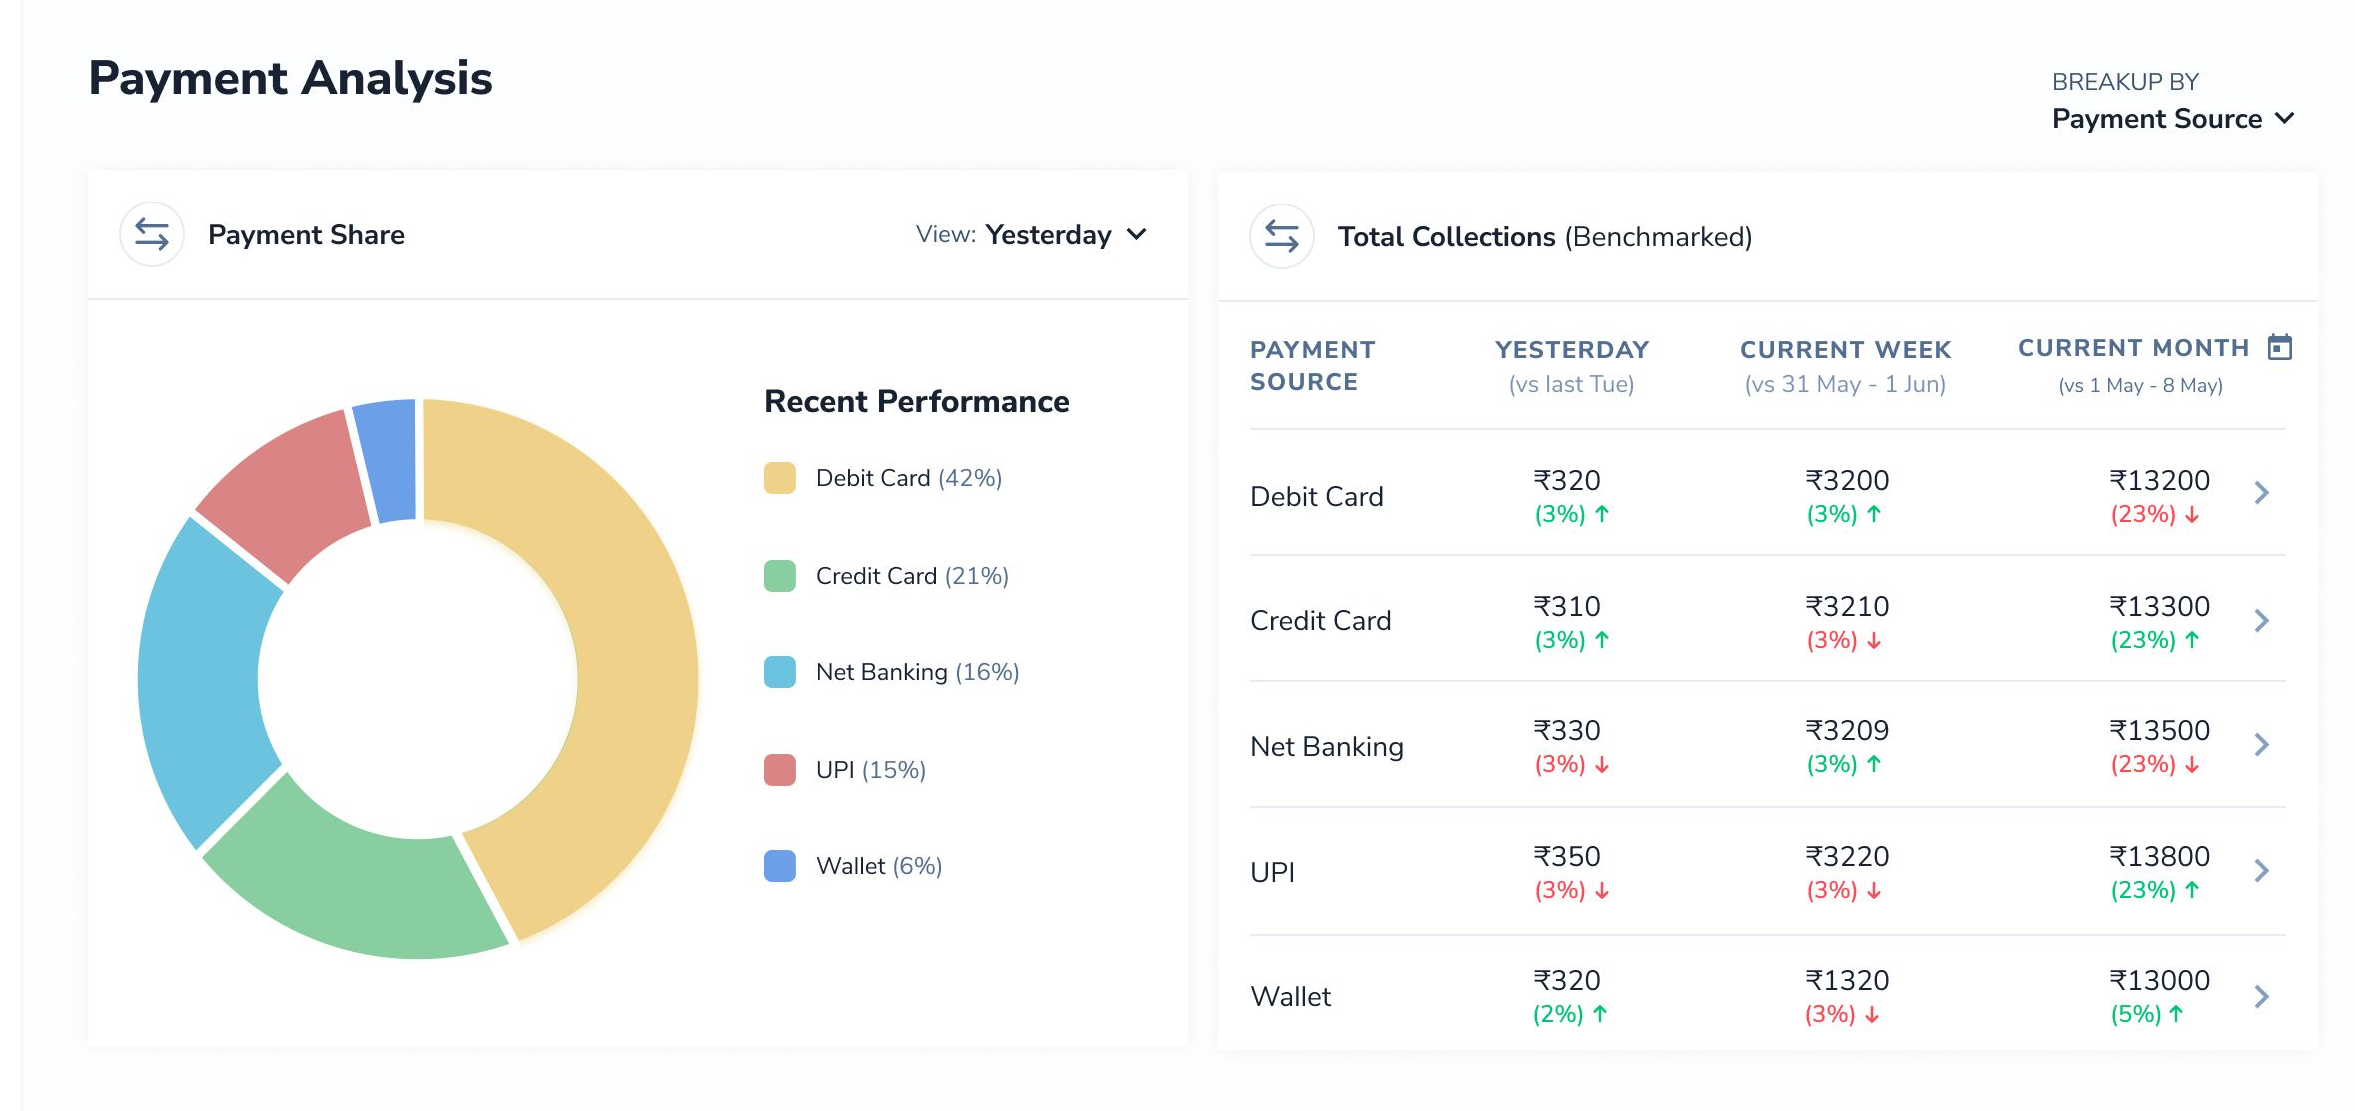
In the Payment Analysis section, you can see the paymode-wise distribution of transaction amount. You can also perform a paymode-wise detailed analysis based on the following benchmarking:
- Yesterday: This shows the increase/ decrease in the total collection on a particular day, as compared to the previous day for each payment option.
- Current Week vs Last Week: This shows the increase/decrease in total collection for a particular week as compared to the previous week for each payment option.
- Current Month vs Any other month: You can customize the date range to compare the payments trend for your current vs any other date range for each payment option.
Similarly, you can also see the payment share for each gateway by using the “Breakup by” filter (select the value as “GATEWAYS” from the drop-down)
